Objectives of the Article
Identify the main components of fiber optic connectors, common types of connectors, and single-mode and multimode fibers; understand the relationship between end-face profiles, end-face quality, and optical performance; and recognize variations in the areas examined during end-face microscopic inspection.
1. Basic Components of Fiber Optic Connectors
The photo of a single-fiber LC plug shows its ferrule, housing latch, boot, and cable. The fiber core is inside the ferrule; the adapter and its alignment sleeve are not shown.
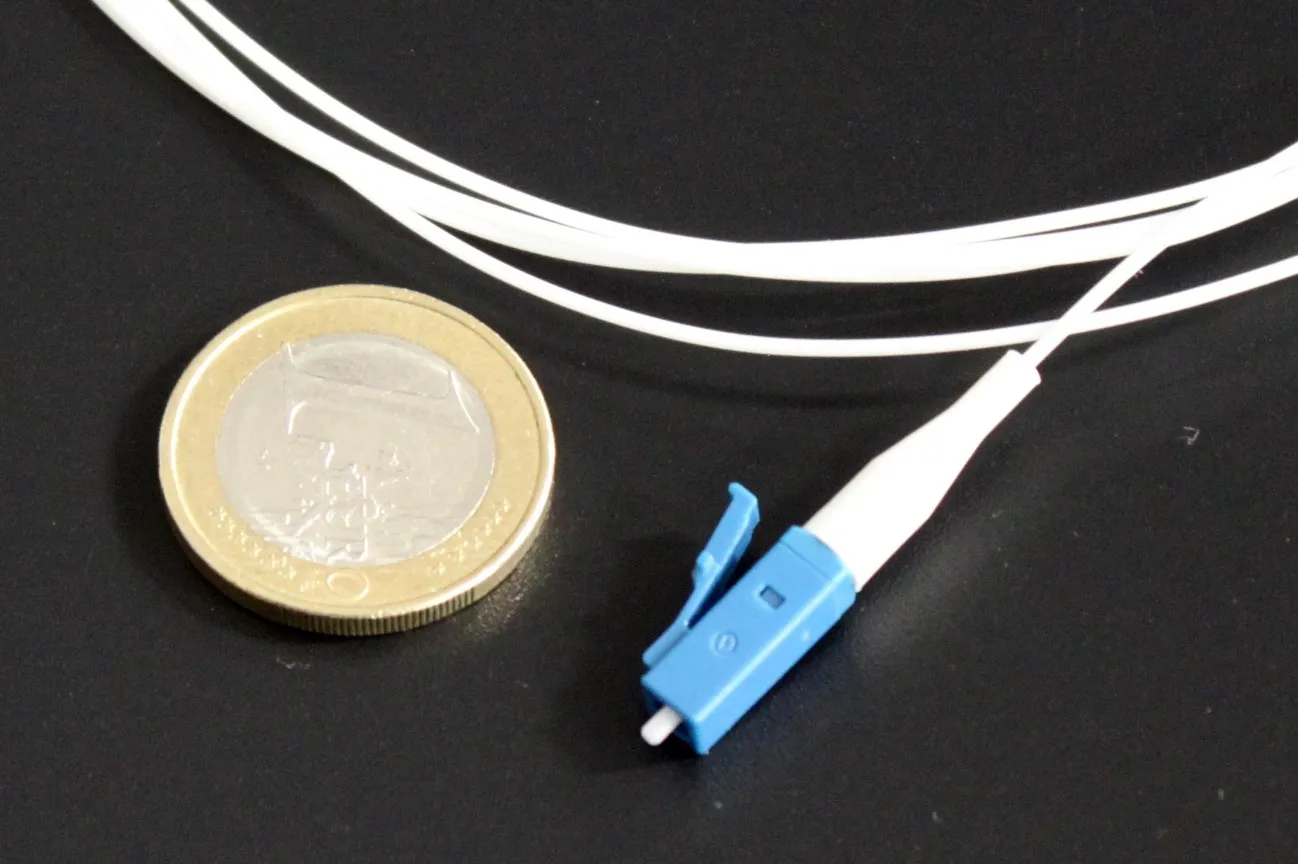
Photo: Christophe.Finot / Wikimedia Commons, CC BY-SA 3.0, unmodified.

The functions of each component are as follows:
- Fiber and core: Light propagates primarily through the core. Lateral or angular misalignment between mating cores reduces coupling.
- Ferrule: Holds the fiber and provides a reference for end-face alignment. Cylindrical ferrules are commonly ceramic; LC typically uses a 1.25 mm ferrule, while SC, FC, and ST typically use 2.5 mm ferrules.
- Housing and latch: Protect the ferrule and secure the plug with a latch, thread, or bayonet mechanism.
- Adapter and alignment sleeve: The adapter mates two plugs; its internal sleeve aligns their ferrules.
- Boot: Relieves pulling and bending stress where the cable enters the plug.
Multi-fiber MPO connectors have a rectangular ferrule with multiple fiber positions. Alignment pins on one mating plug fit corresponding holes on the other. End-face inspection covers each fiber and the ferrule contact surface. See the FOA connector overview.
2. Single-mode (SM) and Multimode (MM) Fiber Optics
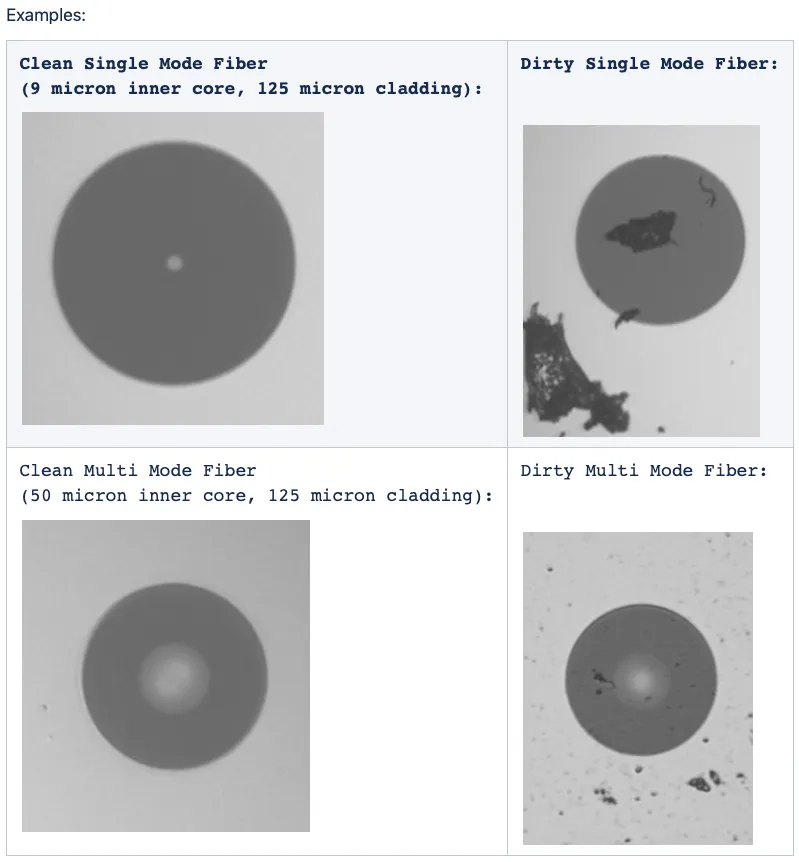
The top row shows single-mode fibers and the bottom row multimode fibers; clean end faces are on the left and contaminated ones on the right. These are examples of end-face appearance; use the fiber specification for dimensions. Image source: F5.
Single-mode and multimode refer to the propagation modes supported by optical fiber and are unrelated to connector types such as LC or SC. The table below lists typical characteristics of common communication-grade optical fibers:
| Comparison Items | Single-mode SM | Multimode MM |
|---|---|---|
| Common Fiber Core/Cladding Dimensions | Approx. 9/125 μm | 50/125 μm or 62.5/125 μm |
| Propagation modes | Primarily supports one transverse mode | Supports multiple transverse modes |
| Common Applications | Long-distance communication links | Short-distance links in buildings, server rooms, and similar locations |
Usable distance also depends on the transceiver, fiber grade, operating wavelength, and link budget. Connector shape alone does not establish whether the fiber types match. The FOA fiber guide describes their dimensions and applications.
3. Common Connector Types
The following photos show the appearances of five common types of connectors; even within the same type, there may be different housing configurations.
3.1 LC
LC connectors are small snap-in connectors commonly used in high-density cabling and optical module interfaces. The photo shows two LC plugs side by side.
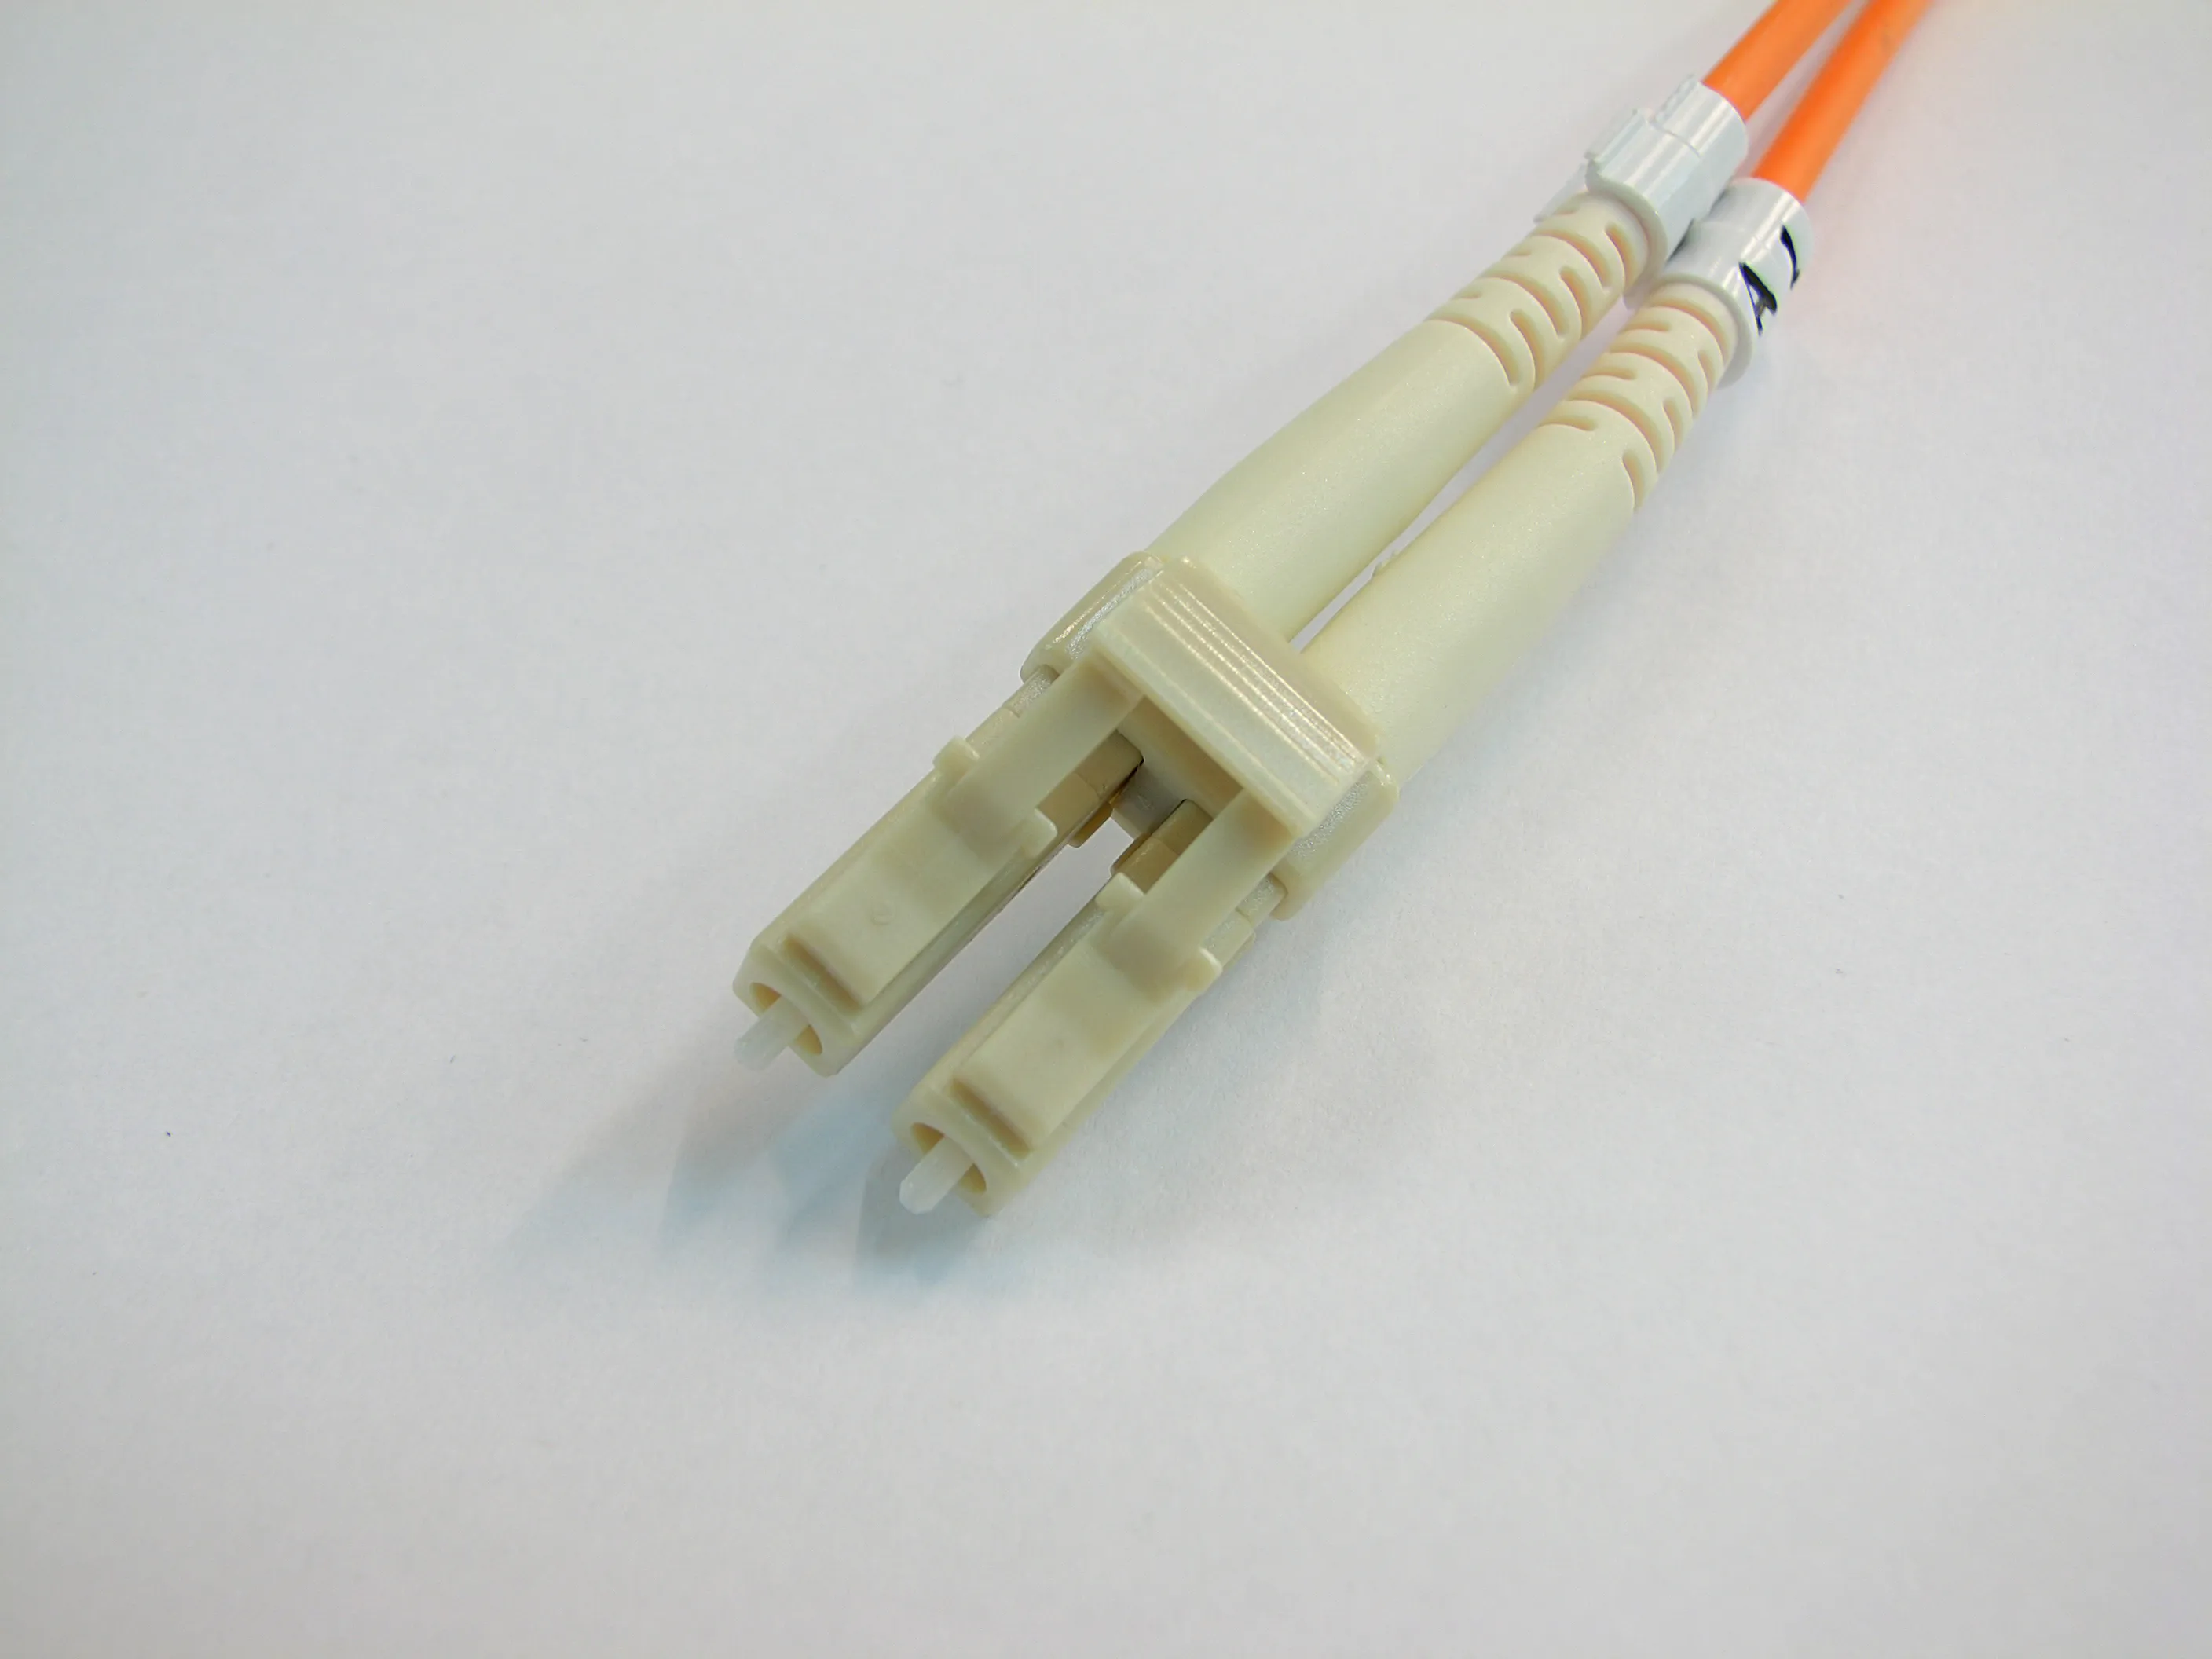
Photo: Adamantios / Wikimedia Commons, CC BY-SA 3.0.

3.2 SC
SC is a square push-pull connector commonly used in patch panels, access networks, and equipment interfaces. The photo shows two SC plugs.
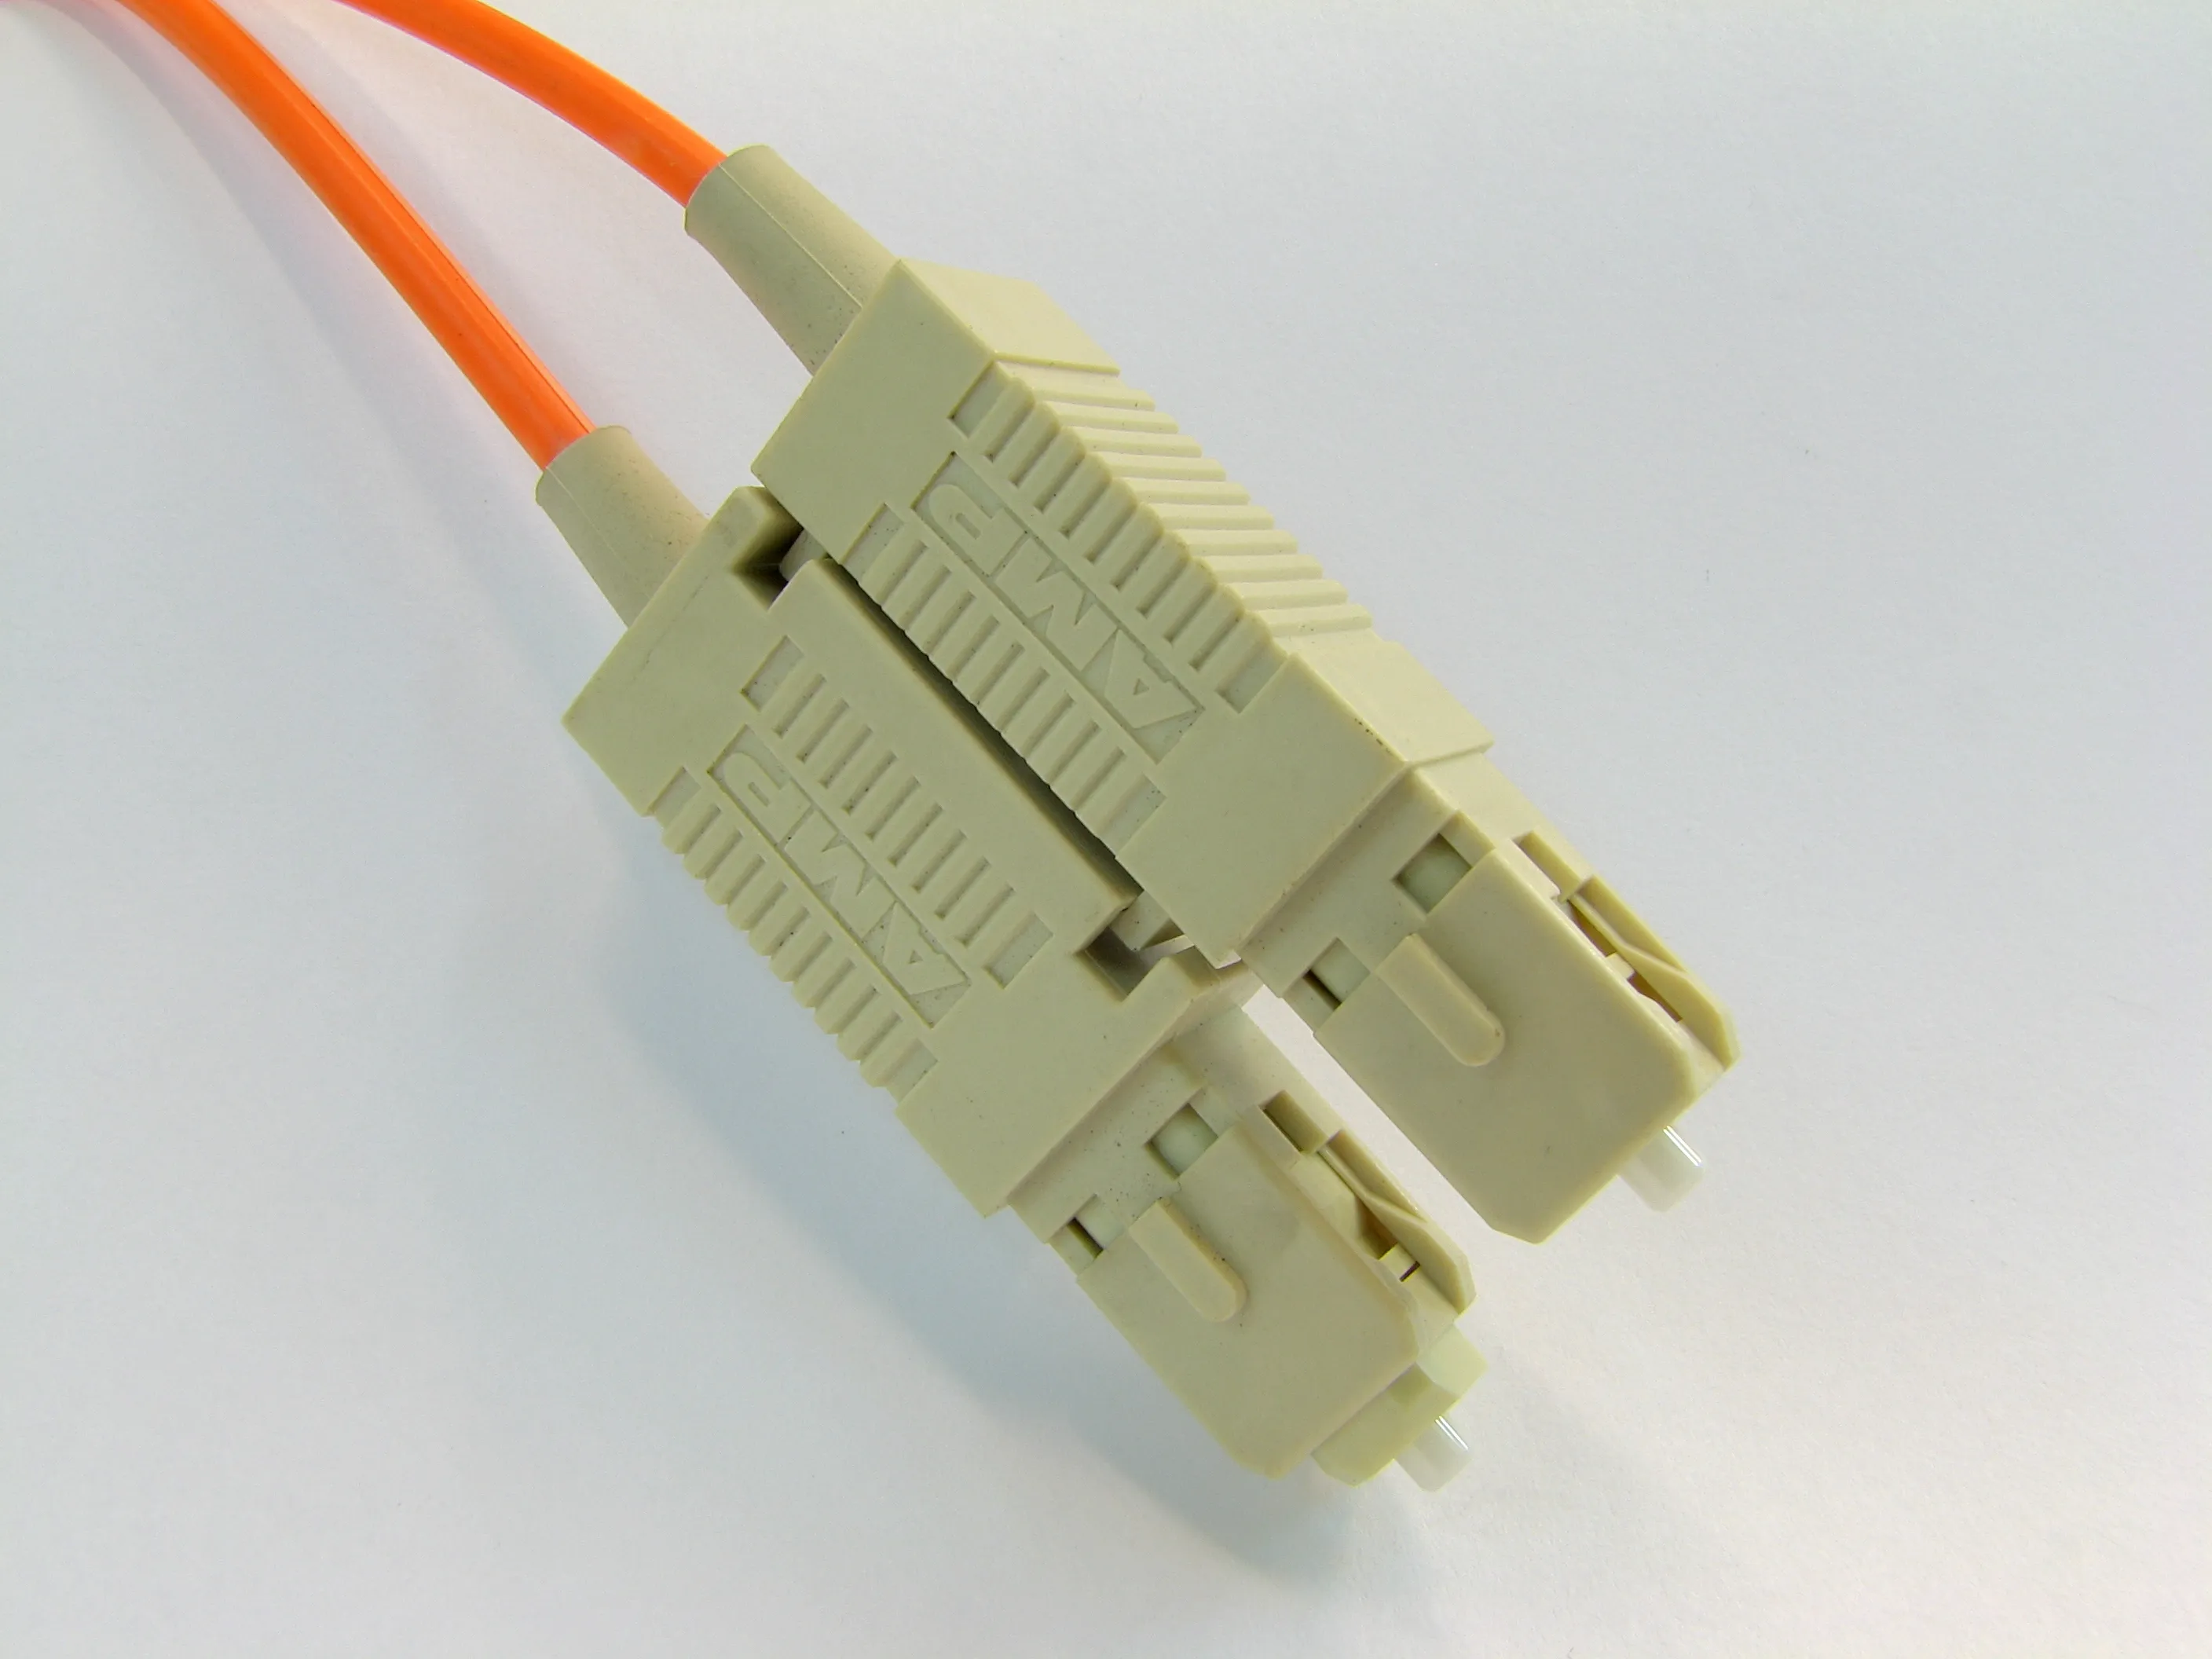
Photo: Adamantios / Wikimedia Commons, CC BY-SA 3.0.

3.3 FC
FC connectors are secured with a metal threaded sleeve and are found in some instruments, test equipment, and older systems.
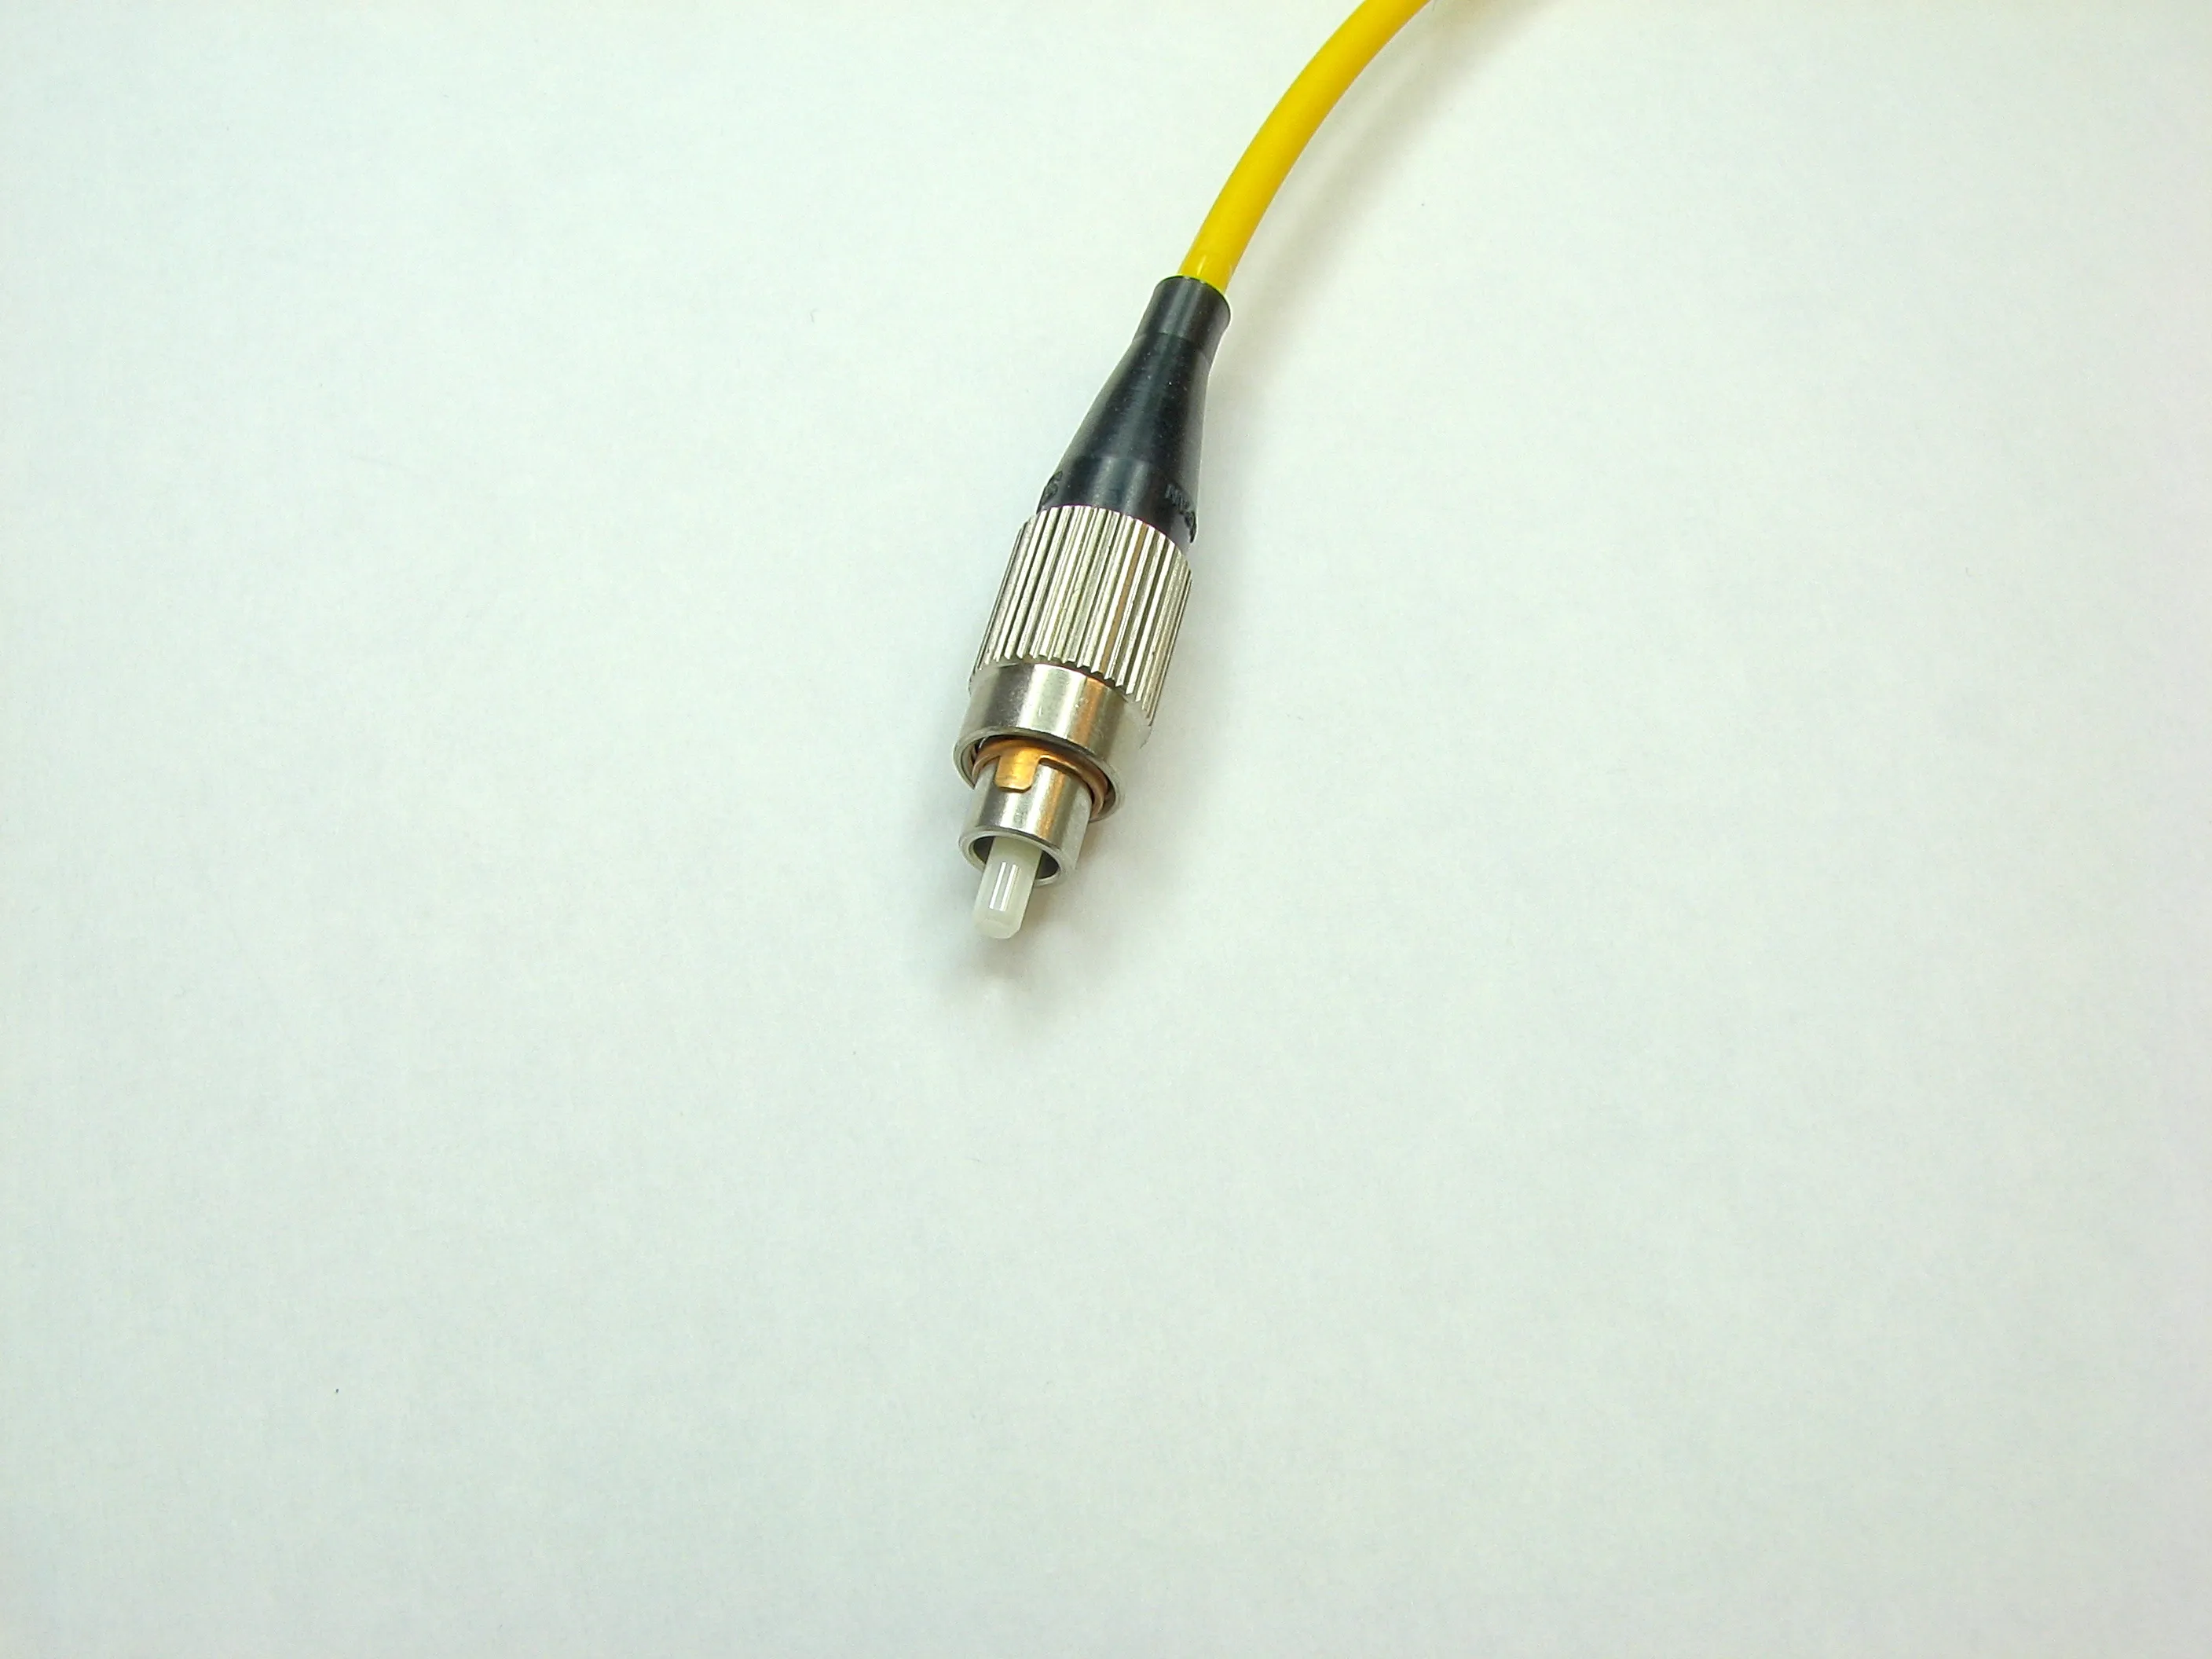
Photo: Adamantios / Wikimedia Commons, CC BY-SA 3.0.

3.4 ST
ST connectors use a bayonet lock mechanism. The opening on the side of the metal sleeve shown in the photo is a clue to identifying this locking mechanism.
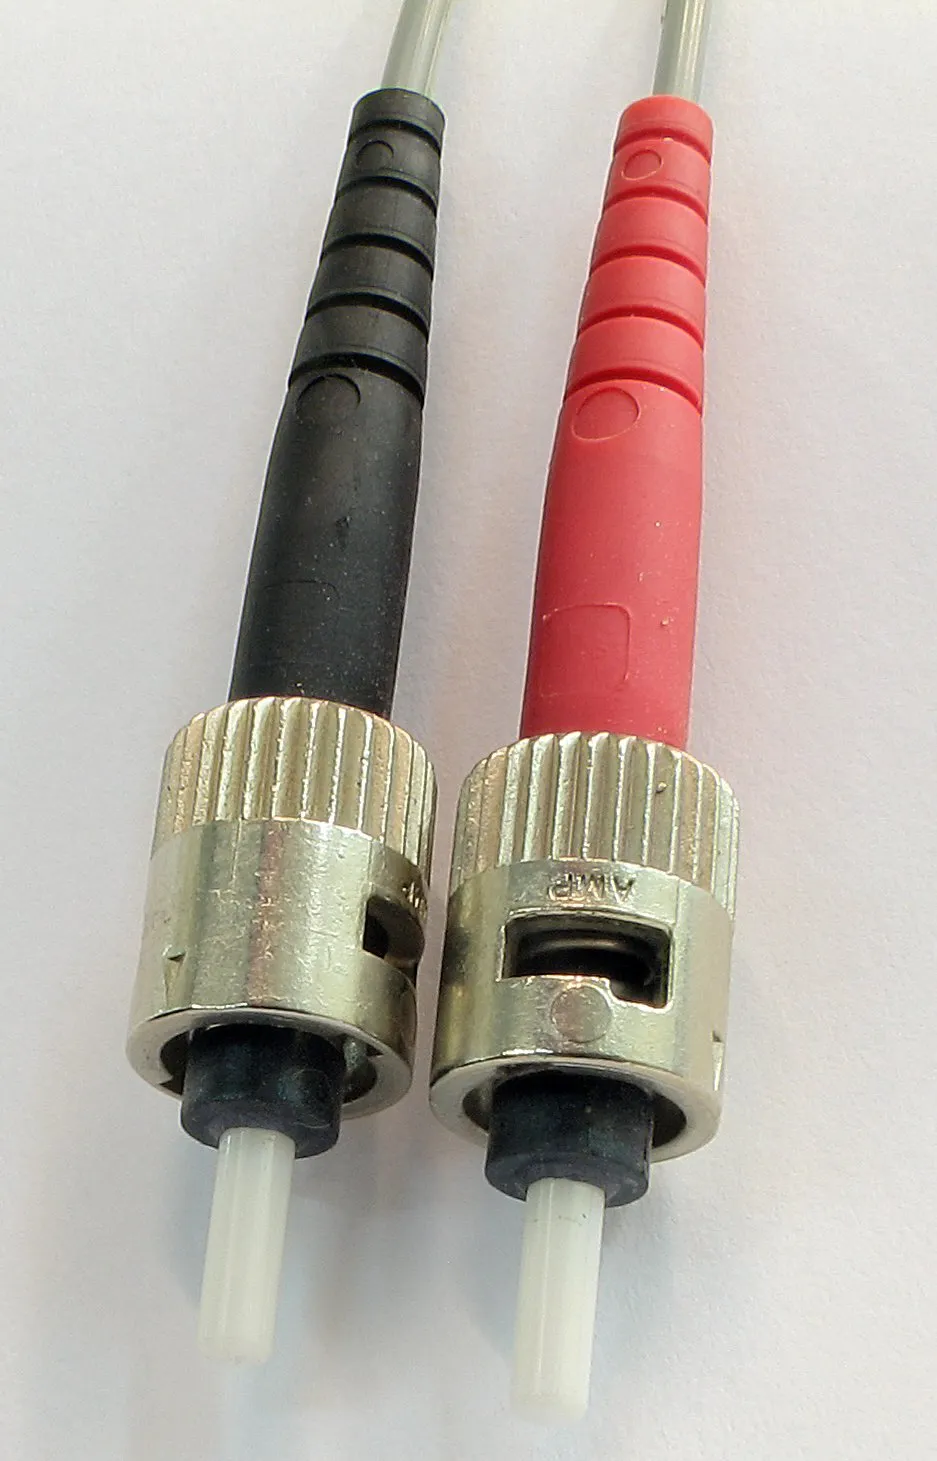
Photo: Adamantios / Wikimedia Commons, CC BY-SA 3.0.

3.5 MPO
MPO connectors use rectangular multi-fiber ferrules and are common in preterminated cabling and parallel optical links. The photo shows a 24-fiber MPO plug face.
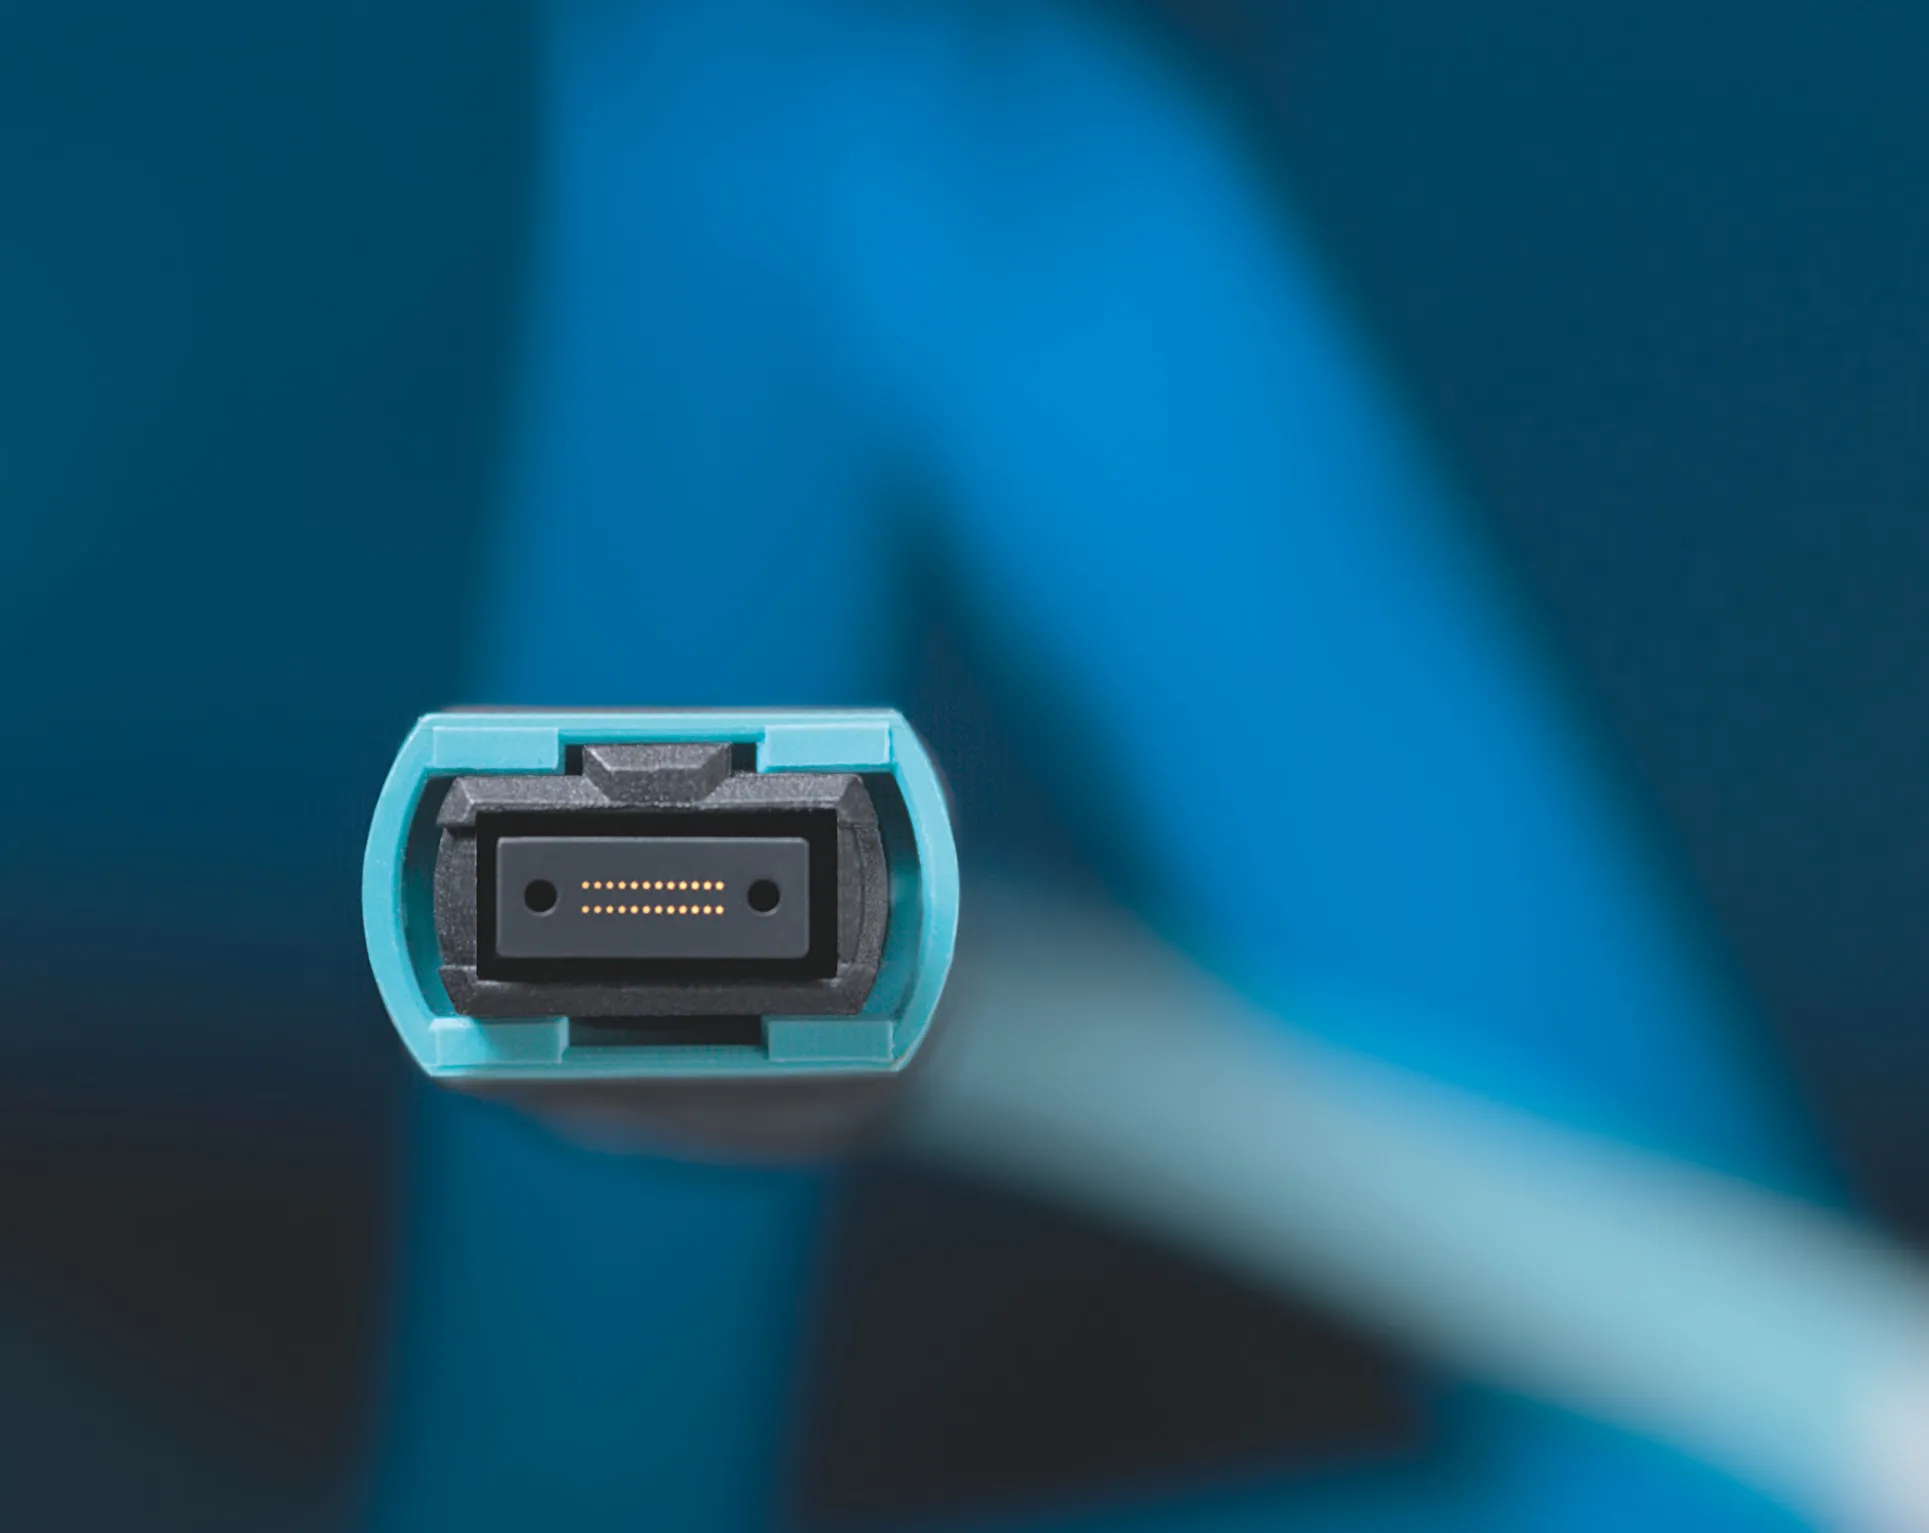
Photo: Reichle & De-Massari / Wikimedia Commons, CC BY-SA 3.0 DE.

4. Common End-Face Finishes
PC, UPC, and APC describe end-face polish and contact geometry, whereas LC and SC describe connector housings. One housing type can use different end-face finishes.
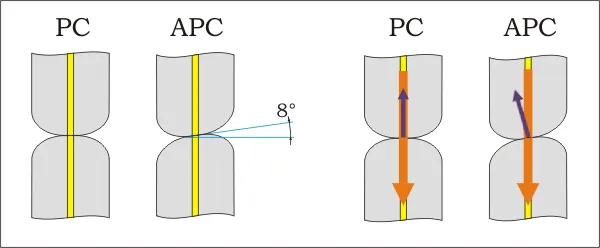
The figure shows the curved, non-angled PC contact surface and the APC surface, typically angled by about 8° to direct reflected light away from the incoming path. UPC generally means a PC end face with an improved non-angled polish, so it has no separate outline in the figure. Image: Kirnehkrib / Wikimedia Commons, CC BY-SA 3.0, unmodified.

| End-face finish | Main feature | Effect on reflection |
|---|---|---|
| PC (Physical Contact) | Polished, non-angled surface designed for physical contact | Reduces the air gap and associated reflections |
| UPC (Ultra Physical Contact) | Improved non-angled PC polish | Typically reduces reflection further; actual performance depends on the product specification |
| APC (Angled Physical Contact) | Angled surface, commonly about 8° | Directs reflected light away from the incoming path |
Do not mate UPC and APC connectors directly. Their end-face geometries differ; even if their housings fit, mating can cause high loss or end-face damage. Color is only an aid to identification, so check the port and patch-cord specifications. FOA explains physical contact and reflection; Fluke Networks explains the risk of mismating.
5. Key Optical Performance Measures
5.1 Insertion Loss
Insertion loss (IL), expressed in dB, is the optical power lost when a connection is inserted into a link. Under the same test conditions, lower IL means less power is lost at that connection. Core offset, an end-face gap, contamination, damage, or poor alignment can increase IL. A whole-link measurement also includes loss from the fiber and splices.
5.2 Return Loss
Return loss (RL) compares incident and returned optical power and is usually expressed as a positive dB value. Under the same definition and conditions, higher RL means less returned light. An end-face gap, its finish, and contamination all affect reflection. Here RL refers to a connection point; whole-link optical return loss also includes other reflections and fiber backscatter. FOA explains the distinction.
6. End-Face Microscopic Inspection and Evaluation Zones
Here, microscopic inspection means observing contamination, scratches, and fixed defects with an end-face microscope or video probe. It does not directly measure IL or RL.
6.1 Microscopic Inspection and Optical Performance
Contamination can affect both measures introduced in Section 5. Particles or an oil film near the core may block or scatter light, resulting in higher IL. Particles can also prevent physical contact and create an air gap, increasing reflected light and resulting in lower RL. The effect depends on contaminant location, end-face finish, and test conditions; an image alone cannot predict a specific loss in dB.
Particles on the cladding or ferrule may move toward the core, transfer to the mating connector, or damage the end faces during mating. Distinguish removable dust and oil from scratches or pits that remain after cleaning. Interpret microscope images together with IL/RL measurements; neither replaces the other.
6.2 How Inspection Zones Changed
The comparison below uses a single-mode PC cylindrical ferrule. Each range is a diameter interval centered on the fiber, in μm; it is not a radius.
| Document | Zones for scratches and fixed defects |
|---|---|
| IPC-8497-1, 2004 working draft (Table 4-1) | 1a core: 0–25; 1b cladding: 25–125; adhesive ring: 120–130; 2 contact zone: 130–250; 3 ferrule zone: 250–400. The adhesive ring and cladding ranges overlap in the source table. |
| IEC 61300-3-35:2015 (Table 1) | A core: 0–25; B cladding: 25–115; C adhesive: 115–135; D contact: 135–250. |
| IEC 61300-3-35:2022 (Clause 5 and Annex A) | A core: 0–25; B cladding: 25–110. Zones C and D no longer have scratch and fixed-defect pass/fail criteria. |
For these single-mode PC examples, the outer diameter of the fixed-defect evaluation zones changes from 400 to 250 to 110 μm; the 2022 edition retains only A and B. The acceptance criteria in different documents cannot be equated from zone diameters alone.
References
- FOA: Fiber Optics Basics and Single-Mode and Multimode Fiber Optics
- IEC 61300-3-35:2022: Visual Inspection of Fiber Optic Connectors and Fiber Optic Ports
- IEC 61300-3-35:2015: Requirements for visual inspection of end faces—previous edition (consistent with the 2015 edition of BS EN)
- IPC-8497-1, July 2004 Working Draft, Table 4-1 (see the provided PDF)
- FOA: Fiber Optic Connector Types and Terminology
- FOA: Inspection and Cleaning of Fiber Optic Connectors
- FOA: A Quick Guide to Fiber Optic Testing
- FOA: Reflectance and Return Loss Measurement